Infographics are one of the most effective ways to communicate complex information quickly. Instead of presenting readers with long paragraphs of text, an infographic combines concise content with visual elements that make ideas easier to understand and remember.
Whether you’re explaining a business process, presenting statistics, creating educational material, or promoting your services, a well-designed infographic can significantly improve engagement.
By combining ChatGPT with Adobe Express, you can dramatically reduce the time required to create professional infographics. ChatGPT helps organize information, generate headlines, summarize key points, and structure your content, while Adobe Express transforms those ideas into attractive, editable infographic designs.
In this guide, you’ll learn how to create infographics using AI.
Why Use ChatGPT and Adobe Express?
Traditional infographic creation usually requires:
- Researching information
- Writing concise copy
- Organizing sections
- Choosing icons
- Designing layouts
- Selecting colors
- Creating visual hierarchy
- Exporting high-quality graphics
With ChatGPT and Adobe Express working together, these tasks become much faster.
Instead of starting with a blank canvas, you begin with a structured content plan.
What Types of Infographics Can You Create?
This workflow supports a wide range of infographic styles.
Examples include:
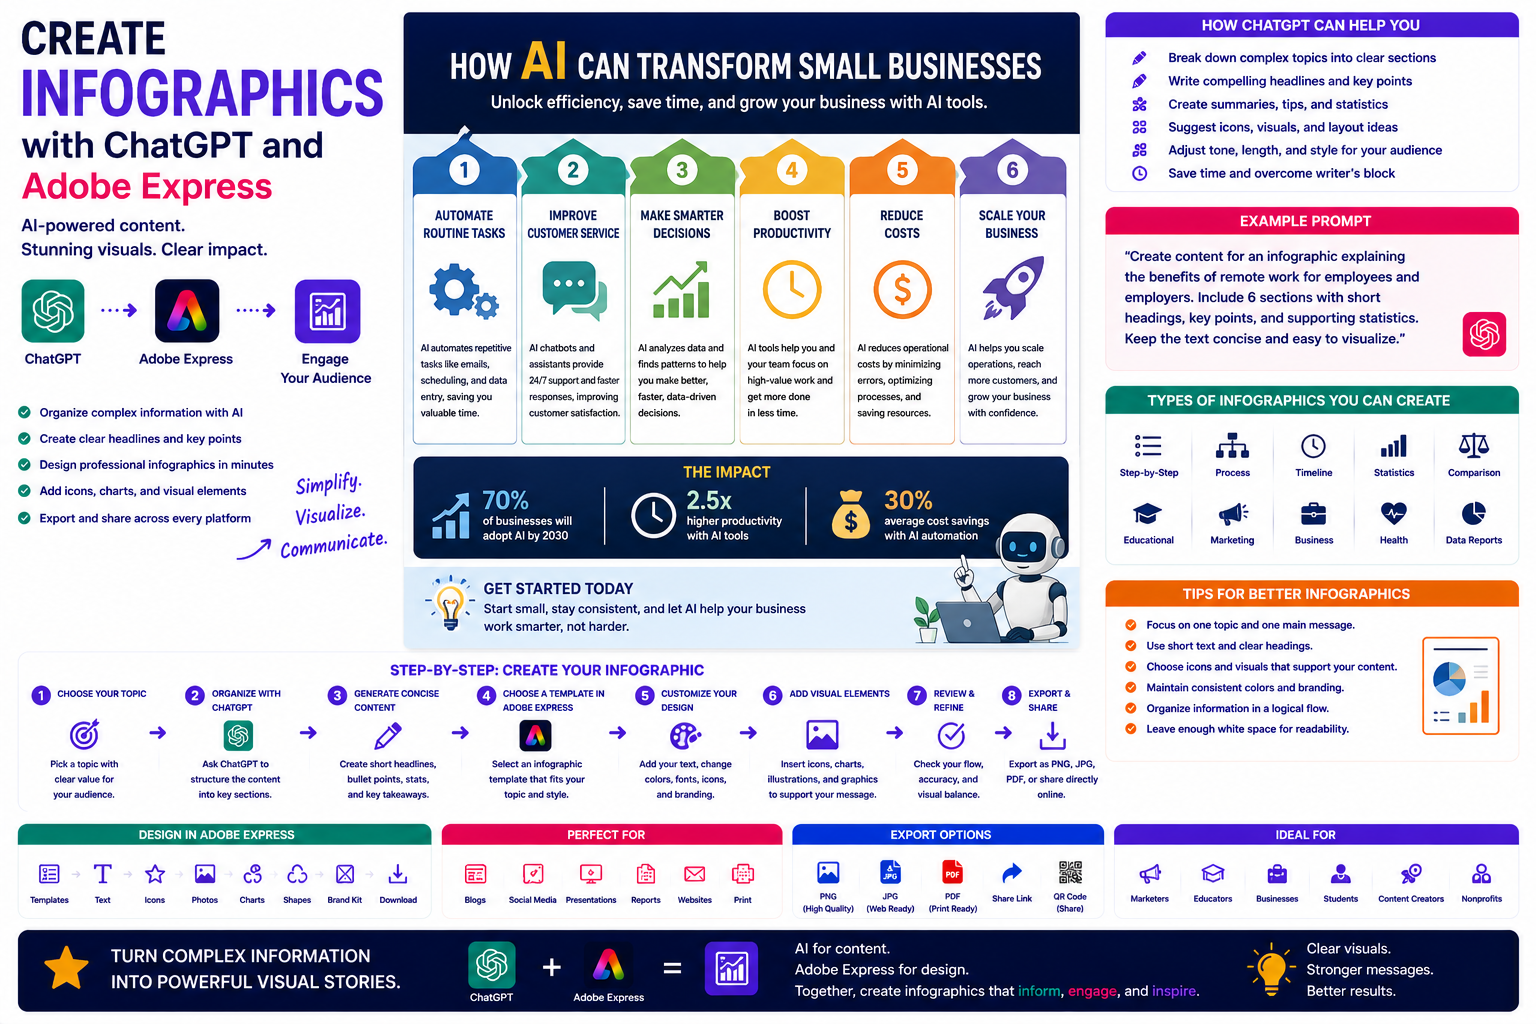
- Step-by-step guides
- Process diagrams
- Timeline infographics
- Statistical reports
- Comparison charts
- Educational posters
- Marketing infographics
- Business workflows
- Health awareness graphics
- Social media infographics
The same workflow works across almost every industry.
Step 1: Choose Your Topic
Start by describing the infographic you want to create.
Example prompt:
Create an infographic explaining how small businesses can use AI to automate customer support.
Or:
Design a timeline infographic showing the evolution of cloud computing.
The more specific your prompt, the better the resulting structure.
Step 2: Ask ChatGPT to Organize the Information
ChatGPT excels at turning complex information into simple sections.
Example prompt:
Break this topic into six clear infographic sections using short headings and concise explanations.
Possible structure:
- Introduction
- Key Benefits
- Step-by-Step Process
- Statistics
- Best Practices
- Conclusion
This structure makes the infographic easy to follow.
Step 3: Generate Short, Readable Content
Infographics work best with concise text.
Ask ChatGPT to generate:
- Headlines
- Bullet points
- Statistics summaries
- Process descriptions
- Tips
- Calls to action
- Captions
Example prompt:
Summarize the benefits of AI automation using six short bullet points suitable for an infographic.
Short text improves readability and visual balance.
Step 4: Create the Infographic in Adobe Express
Open Adobe Express and choose an infographic template.
Adobe Express offers layouts suitable for:
- Vertical infographics
- Square infographics
- Educational posters
- Social media graphics
- Reports
- Presentations
Paste the content generated by ChatGPT into your chosen design.
Step 5: Customize the Design
Adobe Express makes it easy to personalize the infographic.
You can:
- Upload your logo
- Apply your Brand Kit
- Change colors
- Select fonts
- Add icons
- Insert illustrations
- Rearrange sections
- Adjust spacing
Consistent branding helps create a professional appearance.
Step 6: Add Visual Elements
Strong infographics rely on visuals as much as text.
Adobe Express lets you include:
- Icons
- Charts
- Timelines
- Flow diagrams
- Arrows
- Illustrations
- Photos
- Color-coded sections
Visual elements help readers absorb information more quickly.
Step 7: Review the Layout
Before exporting, check that:
- Headings are easy to read.
- Text is concise.
- Icons support the message.
- Colors are consistent.
- Information flows logically.
- There is enough white space.
A clean layout is often more effective than a crowded one.
Step 8: Export and Share
Adobe Express supports multiple output formats.
Share your infographic through:
- X
- Blogs
- Presentations
- PDFs
Infographics are highly shareable and work well across many marketing channels.
Example Prompt Library
Marketing
Create an infographic explaining the customer journey from awareness to purchase using six illustrated stages.
Education
Design a vertical infographic explaining the water cycle for middle school students.
Healthcare
Create an infographic describing the symptoms, prevention, and treatment of seasonal flu.
Technology
Design an infographic showing how artificial intelligence improves customer service workflows.
Business
Create an infographic explaining the five stages of digital transformation for small businesses.
Tips for Better Infographics
Professional infographics usually:
- Focus on one topic.
- Use short text.
- Include clear headings.
- Maintain consistent colors.
- Use meaningful icons.
- Organize information logically.
- Leave enough white space.
Avoid overwhelming readers with too much information.
Common Mistakes
Avoid prompts such as:
Create an infographic.
Instead write:
Design a vertical infographic explaining the benefits of cloud computing for small businesses. Include six sections covering scalability, security, cost savings, collaboration, disaster recovery, and future growth. Use blue corporate branding with modern icons and concise text.
Detailed prompts consistently produce stronger infographic designs.
Best Workflow
Many professionals follow this workflow:
- Choose a topic.
- Organize information with ChatGPT.
- Generate concise text.
- Create the infographic in Adobe Express.
- Apply branding.
- Add icons and visuals.
- Review readability.
- Export for digital or print use.
This process allows you to produce professional infographics much faster than traditional design methods.
Who Should Use This Workflow?
This workflow is ideal for:
- Marketing teams
- Teachers
- Consultants
- Business analysts
- Content creators
- HR departments
- Healthcare professionals
- Students
- Non-profit organizations
- Small businesses
Anyone who needs to communicate information visually can benefit from AI-assisted infographic creation.
Why This Workflow Works
ChatGPT helps simplify complex information before you begin designing.
By the time you open Adobe Express, you’ll already have:
- A logical structure
- Clear section headings
- Concise explanations
- Key statistics
- Design direction
This allows you to focus on visual communication rather than content organization.
Conclusion
Creating infographics with ChatGPT and Adobe Express combines intelligent content generation with professional visual design. ChatGPT helps you organize ideas, summarize information, and create concise messaging, while Adobe Express provides attractive templates, icons, and layout tools that transform your content into engaging visual stories.
Whether you’re creating educational materials, business reports, marketing content, or social media graphics, this AI-powered workflow helps you communicate information clearly while saving significant design time.
Frequently Asked Questions
Can ChatGPT generate infographic content?
Yes. ChatGPT can organize complex information into concise sections, headlines, bullet points, summaries, and calls to action suitable for infographic layouts.
Can Adobe Express create infographics?
Yes. Adobe Express includes infographic templates that are ideal for educational content, marketing materials, reports, timelines, and process diagrams.
Can I use my own branding?
Absolutely. Adobe Express Premium allows you to apply your Brand Kit, including logos, fonts, and colors, to create consistent branded infographics.
Where can I share infographics?
Infographics work well on websites, blogs, LinkedIn, Pinterest, Instagram, presentations, PDFs, email campaigns, and printed marketing materials.
Related Articles
- Create Newsletters with ChatGPT and Adobe Express
- Create Cover Letters with ChatGPT and Adobe Express
- Design Product Catalogs with ChatGPT and Adobe Express
- Create Event Posters with ChatGPT and Adobe Express
- Best ChatGPT Prompts for Adobe Express